“How can I know when it is safe for my family and me to go back to normal?” That has been my question since early spring. To find an answer, I began scouring sites including NET Health, The Tyler Morning Telegraph, Texas Department of State Health Services, The Centers for Disease Control and The John Hopkins’ tracker.
Tyler punches above its weight in healthcare and higher education, so I kept expecting to see a community testing program and studies showing what the risk level was to be out and about in Smith Co.
By May, things had changed dramatically for me. I was the lead IT Project Manager on a hospital ship being built in Tianjin, China. Working in China was no longer viable, and I was open to new opportunities. With some extra time on my hands, I began compiling local case numbers, mortality rates and the best advice for staying safe.
Here are my key findings from five months of COVID-19 data for Tyler and Smith Co.
- The city of Tyler has experienced 184 extra deaths since June (μ + 3.4σ), nearly triple the 68 deaths NET Health attributes to COVID-19 in Smith County.
- By October 1, Smith Co. had 4,901 tested cases of COVID-19, not 3876. The actual city of Tyler COVID-19 count was likely 13,261 — at the minimum, the count was 7,011; at its maximum likelihood, it was 19,511. Many of these went untested.
- At the beginning of October, COVID-19 was spreading 16.5 times faster in Smith Co. than it was in May (34.7 new cases per day vs 2.1)
- Most schools have similar policies but actual implementation varies, resulting in large differences in case counts. Individual school leadership seems key to success.
- Wear a mask!
184 extra deaths in Tyler since June 2020
FiveThirtyEight says, “Mortality data remains the most reliable measure for assessing the status of the epidemic.” Worldwide, there is a disparity between the number of official COVID-19 deaths and extra deaths and many people are dying without adequate COVID-19 testing. In the United States there are 200,000 official deaths from COVID-19. But this year, our country has experienced over 278,000 deaths beyond normal for previous years.
What does this national and worldwide trend look like in Tyler, with our population of 106,985?
According to NET Health’s Oct. 1 report, Smith County has had 68 deaths attributed to COVID-19. But if we look at previous death tolls from other years, we start to see a larger discrepancy.
The average number of deaths in the city of Tyler between June and September from 2016-2019 is 967. In 2020, Tyler suffered 1,151 deaths. That is 184 extra deaths, nearly three times the official COVID-19 death count.
If the 2016-2019 deaths had huge swings on a monthly basis, then it might be reasonable to say the 2020 death count is a case of random chance — but an “extra” 184 deaths during any normal year is, mathematically, unrealistic.
To understand why, we measured the standard deviation for the last years. The standard deviation for the last four years is 53 deaths; meaning, it is normal to expect the 2020 deaths to be within a range of 53 above or below 957.
Data that is one standard deviation or less from average is random chance. Two standard deviations occur occasionally (1 in 22) by chance. At five standard deviations, you book airline tickets to Stockholm to go collect your Nobel prize.
The 2020 death rate in the City of Tyler from June through September is 340% of the standard deviation. That would occur by chance about once every 2000 years.
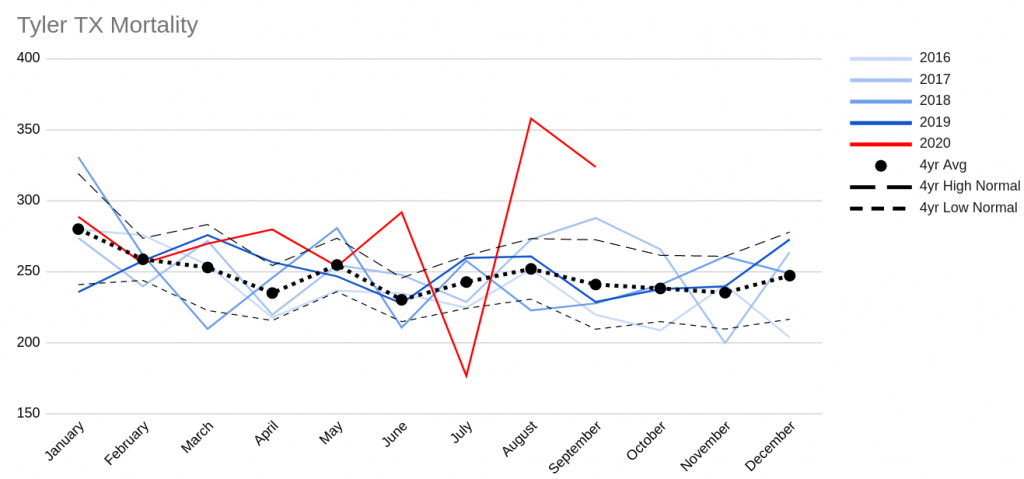
One hundred eighty-four extra deaths is based on the average. If normal deaths were high, there could be as few as 97 extra deaths; if normal deaths were low, there could be as many as 270 extra deaths.
Tyler’s July and August extremes
As we look further into the data on Tyler’s mortality rate, we start to see fluctuations: July 2020’s death count is unusually low and August’s is remarkably high. One possibility for these extremes may be that some July deaths were probably reported in August.
Specifically, July’s death rate is about 3.5 standard deviations lower than average (μ – 3.55σ) and August’s death rate is about five standard deviations higher than average (μ + 4.96σ Wow!).
If July and August are averaged together, their excess deaths come to two standard deviations above average (μ + 1.95σ), reasonably consistent with June (μ + 3.98σ) and September (μ + 2.63σ).
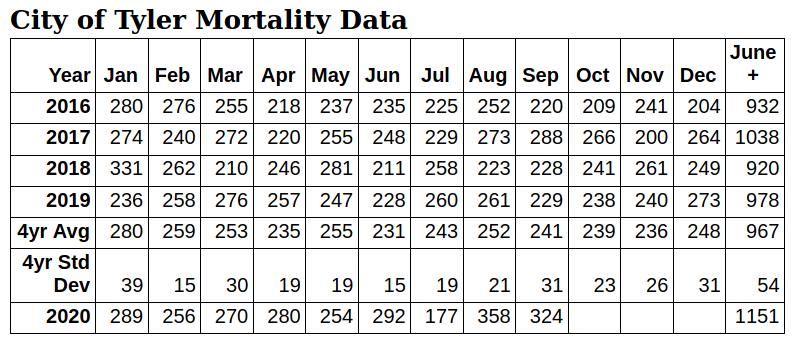
Mortality data is from the Local Registrar of the City of Tyler, Vital Statistics Director.
Smith County positives are higher than confirmed
Until October 7, 2020, NET Health reported confirmed test cases based on PCR tests, which detect the SARS-CoV-2 DNA directly and are considered the gold standard for COVID-19 testing. The confirmed number has sometimes been considered a key metric for how Smith County is faring during the pandemic.
Rapid antigen tests have been reported as a separate “probable” number not included in the headline total. This is because antigen tests are less reliable. However, this is a lopsided concern. The false negative rate for antigen tests is much higher than the false positive rate.
If someone has an antigen test and is reported negative, there is a chance that they may actually be positive. If someone has an antigen test and is reported positive, it is very unlikely that they don’t have COVID.
Dr. Cardinalli-Stein, ambulatory chief quality officer for Christus Trinity Clinic, and Dr. Faber White, chief medical officer for Christus Good Shepherd Health System, said about antigen tests, “The likelihood of someone receiving a false positive result is incredibly small, essentially the same as a PCR test.”
It makes most sense to report positive antigen tests in the positive case count found in the headline total. The reality is that on October 1, testing indicates that Smith Co. has had at least 4,901 cases of COVID-19, not 3,876.
NET Health’s updates now reflect this, which resulted in a jump in Smith County total case count of 1,281 from October 6 to 7.
The 4,901 COVID-19 cases and 68 deaths is based upon direct but limited testing and gives a Smith County death rate of 1.39%.
If that death rate is applied to the City of Tyler’s excess deaths, it indicates that between June 1 and Oct. 1, Tyler had between 7,011 and 19,511 COVID cases, the most likely total being 13,261, working from an 184 extra death count. Most of these cases went untested.
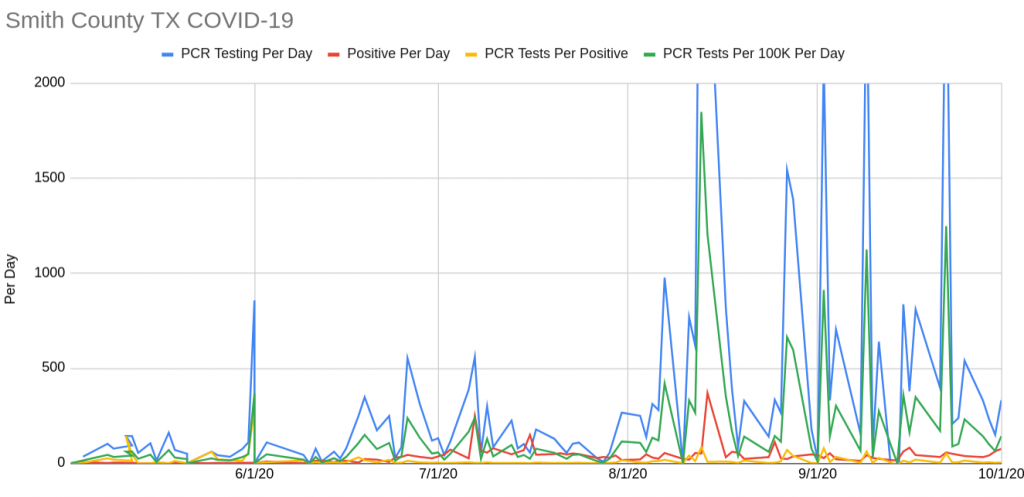
Real life reveals that daily stats are quite noisy, with low days right next to high days, making conclusions confused and difficult. Weekly and monthly averages tell a much more understandable story.
In Smith Co., COVID-19 burned at a low rate throughout the spring and summer, gradually growing from one case per day to 10. Then during the week of June 21, it suddenly hit the curve and took off, doubling each week for about a month. Since then, it has spread within a broad band of 30 to 75 new cases each day.
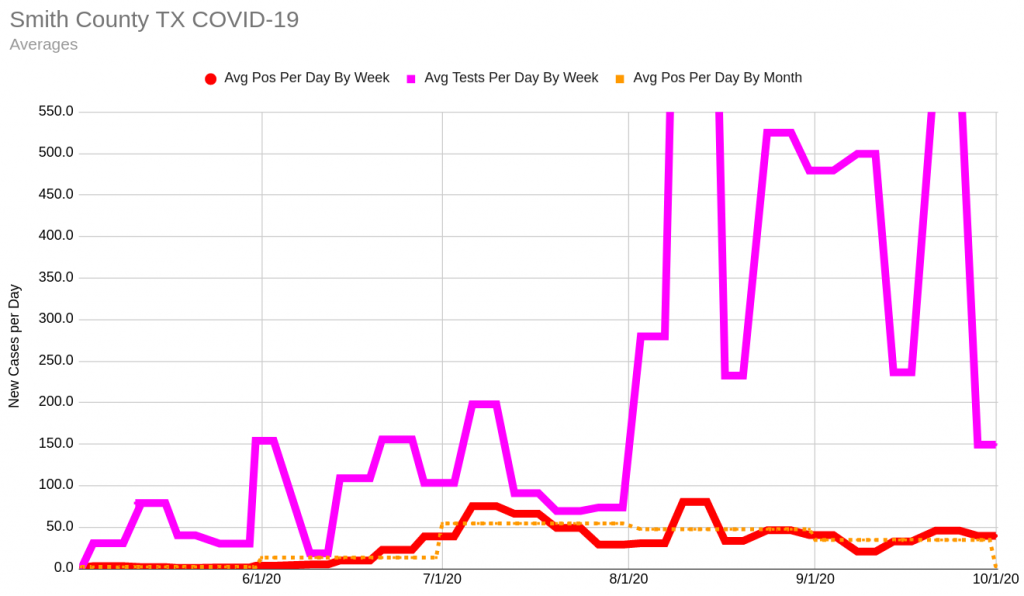
At the beginning of October, averaging 34.7 new cases per day, COVID-19 is 16.5 times as widespread in Smith Co. as it was in May, when it averaged 2.1 new cases per day.
September’s monthly average hides daily swings which have prevented Smith Co. from meeting the White House criteria of two weeks of consistently declining case counts.
Until June, it was unusual for the county to have more than 50 tests per day. But at the beginning of June, testing went up to 150 per day and averaged at 75 to 150 tests per day for June and July, with occasional variations.
At the beginning of August, testing increased substantially. August and September showed extremes, alternating weeks of testing over 500 with some weeks testing fewer than 250.
Diving into the data helps reveal why the testing numbers vary significantly. At Smith Co.’s highest short-term testing effort, there were several large campaigns which tested many people all at once. The peak came on August 13 and 14 when over 7,000 tests of high-risk populations were done in two days.
The rate was not sustained, however, and remains a single large spike in the data. There are similar but smaller efforts reflected in the data, as well. They seem to occur approximately once a week, but not reliably.
Around mid-June, the rate of positive cases begin to loosely correlate to the number of tests done, but the link isn’t firm: test more and find more, look less and find less.
The percentage of test results which are positive are potentially an important and useful statistic to determine if we are testing enough. Unfortunately, the testing numbers come from DSHS, which has changed methodologies several times, and the data isn’t available.
So can we go back to normal yet?
In late March 2020, Dr. John Hellerstedt, commissioner of Texas DSHS, Smith County Judge Nathaniel Moran, and Tyler mayor Martin Heines all declared COVID-19 a public health disaster and Smith Co. began a shutdown of non-essential services.
The shutdown was a huge emotional, financial, spiritual and psychological sacrifice. It was a sacrifice of safety, especially for essential workers.
The White House established specific criteria around symptoms, cases and hospitalizations for reopening. Neither Texas in general nor Smith Co. has met these standards. Key problems are: lack of 14-day decrease in positives, insufficient data on influenza-like and COVID-like illnesses, and insufficient testing.
Texas’ shutdown was one of the shortest in the country, lasting only 30 days. Case counts quickly climbed again. On July 2, Gov. Greg Abbot encouraged staying at home and wearing a mask. But at the end of September, most remaining restrictions were relaxed to 75% capacity.
Think back to May when the shutdown ended. How safe did you feel going to the grocery store? The church building? The bar?
Now consider this: Since the beginning of October, the positive count for COVID-19 is going up 16.5 times faster than in May.
On October 15, as the Tyler Loop was finalizing this article, NET Health introduced a new metric to judge community spread, the seven-day rolling rate of COVID-19.
To calculate community spread, NET Health will take the average number of COVID-19 cases from the previous seven days and divide it by the population of the county, then multiplied by 100,000, according to NET Health communication director, Terrence Ates.
The new value is not directly equivalent to the raw number of cases. It tracks the same information but in a format that allows comparison across communities of different population sizes. In the graph above, it tracks the bold red line exactly but indexed per 100K population rather than by case count.
NET Health computed the Smith Co. rate for the week of Oct. 13, 2020, as 25.29, which they characterize as “moderate.” This is a developing metric. Using NET Health’s formula, the Tyler Loop computes the seven-day rolling rate historically as:
- Week of 5/9/20: 1.4
- Week of 6/3/20: 1.5
- Week of 7/3/20: 16.7
- Week of 8/7/20: 13.2
- Week of 9/4/20: 17.4
- Week of 10/9/20: 23.4
Additionally, a recent study in Nature indicates COVID-19 curtailment in Texas will need at least two of the following:
- Double testing
- Double contact tracing
- Reversal of reopening by 25%
Please give me some good news
The bad news: In Smith Co., new COVID-19 cases are increasing 16.5 times faster than when the shutdown ended.
The good news: We know a lot more about the virus now than we did then. With mitigation strategies, we can manage the risk better.
There is one simple thing we can all do. Wearing a mask is easy, cheap, and reduces the spread of COVID-19 to others. It also provides protection to the wearer.
There is another good reason to wear a mask: You can be infectious before you feel sick. You may feel fine and go to the store, work or school but be invisibly spreading the illness to everyone you meet.
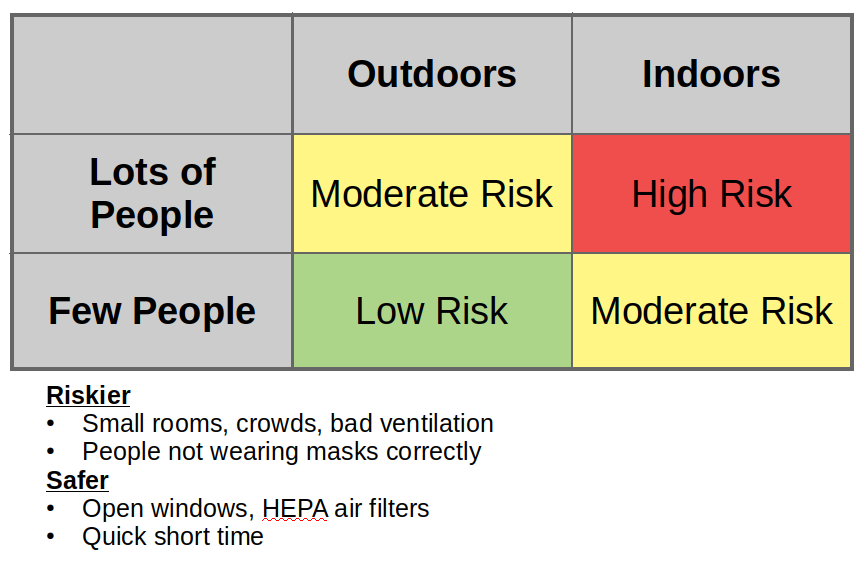
Tyler is “wearing-not-wearing” masks
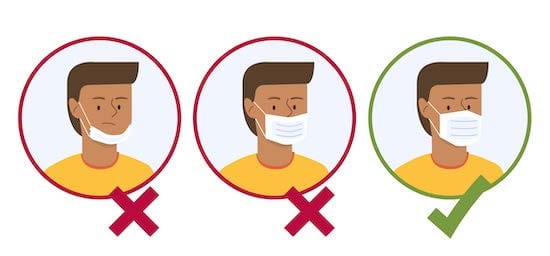
Out and about Tyler, many people are wearing masks and distancing, but it is also easy to see many people who are not wearing masks or are “wearing-not-wearing” masks around their chins or pulled down to leave their nose exposed.
Barring complete isolation, staying six feet apart and wearing masks are our best defense in slowing the virus if we want a life in public. They only work when we wear them consistently and correctly.
What about school?
By October 1 2020, 657,572 children had tested positive for COVID-19 in the United States, an increase of 13% in just two weeks. According to NET Health, Smith County has had 910 COVID-19 positives who were under 21 years of age. Tyler Independent School District reported eight student and 12 staff cases during the week of Sept. 28 – October 4 2020.
According to the CDC, at least 100 children have died of COVID-19 in the U.S. Older children seem similar to adults as far as COVID-19 is concerned; younger children often experience lower symptoms but are even more infectious than adults.
In Texas, school districts are required by the state to report all positives. At the district level it breaks out students and staff, but individual schools are often not releasing that information.
The Tyler Loop confirmed case counts for the schools below as a sampler of what’s happening locally. Children are typically not tested unless exhibiting symptoms, so this reporting is likely a significant undercount.
The entire country has struggled with how to bring children back to school safely. The American Academy of Pediatrics recommends that all children over two wear masks, desks are six feet apart, children be cohorted in small groups and outdoor spaces be utilized wherever possible.
Three schools are illustrative of the COVID-19 situation in Smith Co. education.
- Hazel Owens Elementary School is a public K-5 elementary school in Tyler ISD. It has 610 students and a teacher ratio of 16:1. Owens’ COVID-19 policies are mandated by Tyler ISD.
- Cumberland Academy (including Leadership Academy) is a tuition-free K-12 charter school with 1949 students and a teacher ratio of 13:1.
- All Saints Episcopal School is a private school offering K-12 to 700 students with a teacher ratio of 5:1.
On paper, Owens, Cumberland Academy and All Saints’ COVID-19 precautions seem similar. In practice, their results have been starkly different. In about two months of schooling, Owens has had one case (0.15%), All Saints has had three (0.36%), and Cumberland Academy has had 30 positive cases (1.36%).

There is currently insufficient data available locally and nationally to provide a quantitative explanation of the disparity in results. As data becomes available, the Tyler Loop will continue reporting on this topic.
Qualitatively, it appears that similar policies have been implemented differently by different administrations. Owens and All Saints’ leadership have created an environment with a high compliance rate for mask wearing and social distancing even for the youngest students.
Cumberland Academy states “We have confirmed that we can safely educate students face-to-face.” (District Letter to Parents-2.pdf, 10/9/20) Cumberland’s positive rate is over nine times Owens’.
Even allowing for some element of luck due to widespread community transmission, there is a large disparity between the effectiveness of individual schools in controlling COVID-19.
The difference may point to leadership as an important variable. If superintendents, principals, teachers, parents and others are leading by example and tone; if they avoid COVID-fatigue and keep enforcing their policies carefully, then some schools have demonstrated that they can keep their children safe.
Key takeaway: Wear a mask!
The data is in: The number one thing you can do to make a direct difference in Smith Co. is to wear a mask every time you are around other people. You will save lives and help the economy recover faster.
The source data
There are a lot of sources of data available on the Internet. This analysis is based upon data since May 2020 from the following primary sources:
- COVID-19 positive counts from NET Health. Web access to this data is mostly via the Tyler Morning Telegraph but occasionally directly.
- Total testing counts from Texas Department of State Health Services (DSHS). Unfortunately, DSHS does not report test positives/negatives at a county level, just that the tests occurred. Their methodology has changed multiple times.
- Mortality data for the city limits of Tyler, TX from the Local Registrar / City of Tyler, Vital Statistics Director, via email.
- Hospitalization rate data from Texas2036. Unfortunately, hospitalization data has been delayed, intermittent, and of questionable quality since late July. This data has not been used in this article.
- The data this article is based on is available here.
Stephen Fierbaugh lives in Smith County, Texas. He is a certified Project Management Professional and has an MA in Intercultural Studies with a focus on ICT4D technology. Prior to COVID-19, Stephen was lead IT project manager for Mercy Ships’ new hospital ship, being built in Tianjin, China. Now he is available for new opportunities.
Love what you're seeing in our posts? Help power our local, nonprofit journalism platform — from in-depth reads, to freelance training, to COVID Stories videos, to intimate portraits of East Texans through storytelling.
Our readers have told us they want to better understand this place we all call home, from Tyler's north-south divide to our city's changing demographics. What systemic issues need attention? What are are greatest concerns and hopes? What matters most to Tylerites and East Texans?
Help us create more informed, more connected, more engaged Tyler. Help us continue providing no paywall, free access posts. Become a member today. Your $15/month contribution drives our work.


