The Smith County Commissioners Court gave final approval for the fiscal year 2021-2022 budget September 7, 2021, during its 9:30 a.m. meeting.
Since its unveiling at the June 22 Commissioners Court meeting, the proposed budget has been the subject of various workshops culminating in its final form to date.
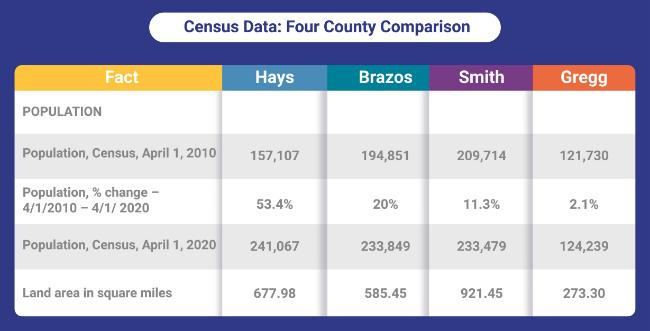
When the county budget team proposed law enforcement salary increases and a more competitive pay scale, they drew data from outside sources comparable in population to Smith County, including Hays and Brazos counties.
Prior to the 2020 census, Smith, Brazos and Hays were ranked 22, 23 and 24, respectively, by population. Population growth in Hays and Brazos counties has surpassed Smith County, but the three remain ranked at 22, 23, and 24 – although flipped from their previous order.
Of the seven counties adjacent to Smith County, Gregg County has the most comparable population to Smith County.

A closer look at comparable counties
Data from the 2015-2019 American Family Survey indicates similarities beyond population. Each county is home to college and university communities and located within 100 miles of a major metropolitan area.
How do these county budgets compare?
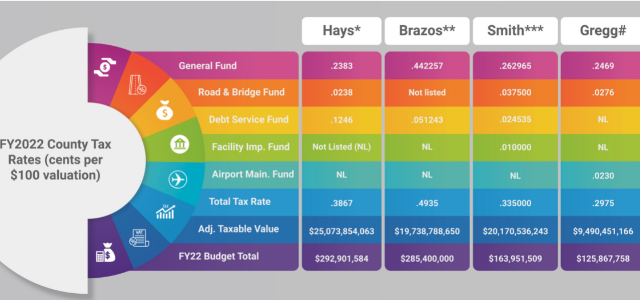
First, a look at tax information.

Of the four counties, Gregg has the lowest overall tax rate and the lowest total proposed budget, as well as the lowest Total Adjusted Taxable Value.
Smith County’s tax rate is lower than both Hays and Brazos.
Moran said he does not focus on tax rate and believes “if we get the use right, the tax rate will take care of itself.”
How do these comparable counties spend their money?
Table 3: County Budget Expenditures by Function for FY2022
(In Percentage of Budget)
| Function | Hays^ | Brazos^^ | Smith^^^ | Gregg## |
| General Government | 7.7% | 28% | 18% | 21% |
| Judicial | 6.9% | 17% | 15% | 17% |
| Law Enforcement | 18% | 18% | 17% | 37% |
| Corrections | —- | —- | 19% | —- |
| Juvenile Services | NL | 5% | 5% | NL |
| Roads & Transportation | 8.7% | 16% | 10% | 12% |
| Public Service/HHS | 4.4% | 8% | 1% | 4% |
| Capital Improvements | 41.6% | 4% | 10% | 5% |
| Debt Service | 12.2% | NL | 5% | No Debt |
| Operating Transfers | NL | 4% | NL | NL |
| Public Buildings | NL | NL | NL | 4% |
^Hays County Budget 2021 (FY22 percentage breakout not available)
^^Brazos County Proposed Budget FY22
^^^Smith County FY22 Proposed Budget
##Gregg County FY22 Proposed Budget
*Hays County has been involved in multiple Capital Improvement projects (Jail
Facility, Detention Center, Government Center, Courthouse, etc.)
Most counties organize their expenditures by similar types, allowing some comparison of expenditures from county to county. Note the comparison is not in actual dollars spent, but is the percentage of the budget spent on each function.
For example, although Smith and Brazos counties both spend 5% of their budget on Juvenile Services, Brazos County will spend more money, given their larger budget.
Law Enforcement and Corrections
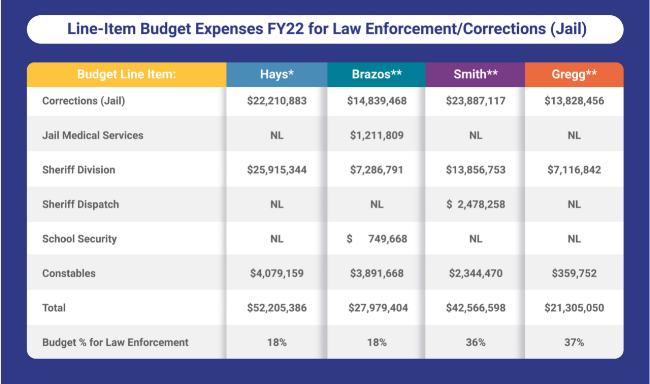
The largest single category of county expense, with the exception of Capital Improvements in Hays County, is Law Enforcement. Here is a look at a few line-item expenses that make up the major portion of Law Enforcement/Corrections expenses.

Using Table 2 data, Smith County’s total budget amounts to 56% of the total Hays County budget. On primary law enforcement expenditures, though, Smith County spends an amount equal to 81% of Hays County expenditures on the same line items.
Smith County spends approximately 200% more than Gregg County – its next-door neighbor – on the same line items, and 150% more than Brazos County.
Law enforcement in East Texas counties Gregg and Smith consume nearly 20% more of their overall budget than in Central Texas counties Hays and Brazos.
Regarding percentage of the budget spent on Law Enforcement, Smith and Gregg rank the highest. In considering the Law Enforcement per capita expenditures for each county, Smith at $182 per person is second to Hays County at $216 per person. Gregg County is third and Brazos County a distant fourth.
One factor for Smith County’s outstanding law enforcement expense may be its size — geographically the largest of the four counties.
Smith County Sheriff Larry Smith said the county’s larger area and population requires
more patrol deputies and criminal investigators, adding to overall law
enforcement cost. “It puts more miles on patrol vehicles,” he said.
Could the crime rate be a potential factor?
According to the latest Texas Department of Public Safety data, the 2019 crime rate for Hays County was 23.79 per 1000 population; in Smith and Gregg counties it was 33.07 and 41.47, respectively.
Smith said, “The higher the crime, the more assets it requires to bring crime in check. It requires a great deal of additional man hours. Gregg County is about one-third the size of Smith County and most of Gregg County’s population is inside an incorporated area,” he said.
In Health and Human Services, Smith County comes in last

Converting the percentages to dollar amounts in the table above provides clarity on county expenditures. Note: Dollar amounts are aggregated from data presented in the county’s proposed FY22 budget.
Over the four counties, budgets to health and human services range from a low of 1% to a high of 8%. Expenditures in this category are for care, treatment and control of human illness and injury including mental health, physical health, welfare programs, special needs and health care for indigent persons.
Smith County allocates the least percentage, 1% towards these services. Gregg County, notably with an overall budget smaller than Smith County, spends 4% of its budget on Health and Human Services. Brazos County earmarks the most, using 8% of its budget to these services.
Moran said Smith County “supports those local entities designed to meet our health and human services needs and we will continue to support them.” He also said that if Brazos County operates in-house health services or a county hospital, the Health and Human Services cost would be greater.
Final budget vote
On the morning of September 7, Smith County Commissioners Court voted on the FY22 Proposed Budget and tax rate. Approval brings the current budget planning cycle to an end.
Moran acknowledges that the final budget will leave some needs unmet. “The most difficult thing for me is seeing a real need to be met this year, but financially, we just can’t get there. I am sympathetic. I recognize that the need is there, but maybe not the greatest need,” said Moran.
“It’s a personal struggle to have to say no. I have to put feelings aside and sometimes, that is a tough row to hoe. But at the end of the day, that’s my job.”
Brenda McWilliams is retired after nearly 40 years in education and counseling. When not traveling she fills her days with community, charitable, and civic work; photography; writing and blogging at Pilgrim Seeker Heretic; reading, babysitting grandchildren, and visiting with friends. She enjoys walking at Rose Rudman or hiking at Tyler State Park. Brenda and her spouse, Lou Anne Smoot, the author of Out: A Courageous Woman’s Journey, have six children and seven grandchildren between them.
Love what you're seeing in our posts? Help power our local, nonprofit journalism platform — from in-depth reads, to freelance training, to COVID Stories videos, to intimate portraits of East Texans through storytelling.
Our readers have told us they want to better understand this place we all call home, from Tyler's north-south divide to our city's changing demographics. What systemic issues need attention? What are are greatest concerns and hopes? What matters most to Tylerites and East Texans?
Help us create more informed, more connected, more engaged Tyler. Help us continue providing no paywall, free access posts. Become a member today. Your $15/month contribution drives our work.


